


LAKE FOREST, Ill.—Without fee income, more than half of banks, thrifts and credit unions would have to report a loss in net income for 2016—with the issue affecting CUs much more than banks.
According to a new report from Moebs $ervices, 76% of all CUs will post higher fee income than net income by the close of the year, while only 25% of banks report a similar situation on their income statements. The Moebs $ervices study projects the outcome based on a review of nearly 12,000 federally insured financial institution’s Call Report data through the first three quarters of 2016.
“Taking a look at the income generated by all account fees in relationship to net income provides some very intriguing insights,” said Michael Moebs, CEO and economist at Moebs $ervices. “There is a large differentiation when comparing the size and type of FIs, over time.”
The study shows FIs greater than $25 billion in assets and those less than $5 billion in assets rely disproportionately on fee income to get net income, but for different reasons, said Moebs.
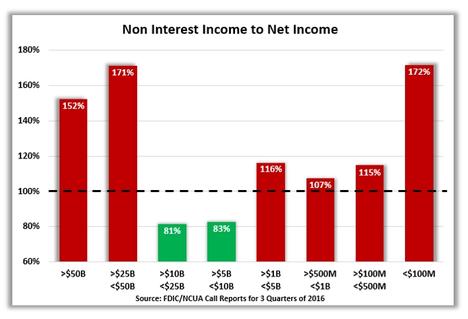
“Applying the ratio of non-interest income divided by net income and examining FIs by asset size shows those financial institutions between $5 billion and $25 billion are more diversified in revenue,” said Moebs. “They have lower expenses with their net interest margin exceeding non-interest expense. This group of depositories use rates and deposit balances to gain more revenue—striking a greater balance with fee revenue as the third element in the diversity of revenue.”
Above $25 Billion
Those FIs greater than $25 billion depend heavily on fees from the trading desk, mergers, acquisitions, and wealth management, explained Moebs. In contrast, those FIs under $5 billion get fee revenue from loans, interchange and overdrafts.
“Interestingly, those banks and credit unions in the mid-sized asset group, $25 billion to $5 billion, are generally well balanced in all fee categories,” said Moebs. “This reaffirms the optimal size group for achieving economy of scale (EOS). These EOS FIs have lower expenses, bring in revenue from several sources, use balances to build relationships, and lower fee prices to better balance fee revenue with volume and price. When an FI achieves EOS, fee revenue becomes one of the items to balance total revenue, instead of requiring fee revenue to make net income budget goals.”
The interest income divided by net income ratio hit a peak in 2007, followed by great volatility from 2008 through 2010, said Moebs.
“The massive, unforeseen loan and bond losses drove net income negative for almost all FIs. Since 2010, non-interest income to net income has shown much greater stability,” said Moebs. “This has been very true for banks and thrifts. Yet, with the exception of the volatile years from 2008 to 2010, the credit unions have shown an increase and are now 9.6% higher than in 2006.”
The increase CU non-interest income to net income at credit unions is the result of CUs increasing both fee revenue from deposits as well as loans.

Michael Moebs, Moebs $ervices
“Banks and thrifts have shown just the opposite, but are now stabilizing fee revenue,” said Moebs. “A chief reason for this disparity between banks and credit unions is the number of checking accounts. The credit unions have increased their number of checking accounts, while banks have done the opposite by reducing their checking accounts in favor of deeper relationships with their customers. With the CUs’ increased accounts, they have taken advantage of increased transaction revenue with interchange and overdrafts.”
The Moebs Study shows those efficient banks and credit unions in the optimal economy of scale asset group ($5 billion to $25 billion) diversify fees, as well as use rate and balance revenue to reduce the heavy dependence on fees.
Net Income As Measure Of Assets
Net income as a measure of assets is an important benchmark, noted Moebs. Net Income for all financial institutions peaked at 1.20% in 2007, he said.
“Today, we see net income to assets is 0.99% or 17.5% less than 10 years ago. When looking at net income between the types of FIs, we see that banks and thrifts are at 21.3% and 20.8% less today, respectively, than they were in 2007. Whereas, credit unions are 5.0% less today,” said Moebs. “Ultimately, while there are exceptions, FIs have not fared well since the start of the Great Recession in 2008. The reliance on fee revenue for net income has become vital to meet higher capital standards to continue the growth in assets.”
The ratio of non-interest income to net income will continue to provide a good performance measure for 2017, insisted Moebs.
“Financial institutions need to become more balanced in revenue sources while increasing net income,” he said. “A movement away from a large dependence on fee revenue is necessary for financial institutions to adjust to improving economic conditions. This means moving towards revenue generate from rates and balances, reducing expenses, and diversifying fee revenue.”