

LAKE BLUFF, Ill.— Credit unions hoping deposit costs would ease this year may need to rethink their funding strategy. A new analysis from Moebs $ervices argues rising Treasury yields and persistent inflation pressures are likely to keep deposit competition intense through year-end, with another Federal Reserve rate hike still possible in 2026.

J.V. Proesel
Moebs President J.V. Proesel said the days when financial institutions could afford to lag market rates without losing deposits are over, warning that increasingly unstable depositors are forcing credit unions and banks to reprice more aggressively. The firm expects the 12-month certificate to remain the industry's primary battleground, as institutions seek to lock in stable funding while avoiding the higher costs associated with longer-term deposits.
Rates across the yield curve have pushed higher since January 2026, and this trend shows no indication of relenting for the remainder of the year, Proesel emphasized.
“Traders are pricing rates higher for longer, and while Fed policy under Chairman Kevin Warsh is yet to be determined, the early consensus for now is the Warsh Fed will take a hawkish approach to stubborn inflation,” Proesel said. “Markets prematurely baked in one-two rate cuts heading into 2026. And, as we predicted earlier this year, the opposite is playing out.”
After three rate cuts at 25 basis points each in 2025, the Fed has held rates steady in 2026.
“We do not anticipate a rate hike when the FOMC convenes this week. However, all our indicators are pointing to a rate hike before yearend,” forecast Proesel.
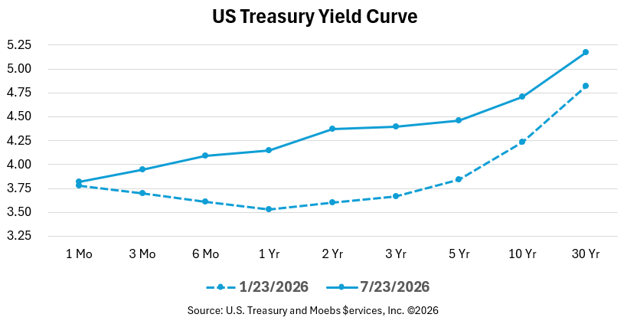
Economic Indicators Driving Treasury Yields
- Oil - Middle East tensions are unresolved and escalating, driving unstable oil prices and energy costs higher, fueling persistent inflation fears.
- Gold – In July the price of gold fell below $4,000, a 28% decline from its record peak near $5,595 in January. The market correction is pricing higher long-term Treasuries, making gold less attractive despite expanding global tensions.
- Deficit – The total outstanding obligation of the United States is approaching $40 trillion and servicing the national debt costs $2.6 billion per day. Deficit spending is untenable and comes with a steep price.
- Labor – The labor market is relatively stable with unemployment remaining historically low at 4.2%, but job creation has cooled. Workers feel the squeeze with inflation still outpacing wage growth.
- Inflation – In June both the PPI (producer price index) and CPI (consumer price index) cooled slightly due to the temporary collapse in oil prices from the ceasefire with Iran, but core inflation still remains above the Fed’s 2% target. At the time of this writing, the ceasefire has vanished and inflation fears have returned with vengeance. If the Iran War continues, energy prices will remain elevated driving up both CPI and PPI rates, and the Warsh Fed will address inflation with a rate hike(s) when in meets in Sept, Oct, and Dec.
Deposit Rates Benchmarks for 2026 Q3/Q4
Moebs July 2026 Quarterly Rate Study depicts deposit rates on the move (Graph below compares national deposit rates from March vs July 2026).
“Deposit dollars are extremely competitive as the notion of core deposits has faded and consumer deposit dollars today are more mobile and rapidly fluid,” Proesel said. “Nevertheless, rates are a key price component to attract and retain deposits, especially among savers and relationship-oriented consumers who have excess funds to park in depositories.”
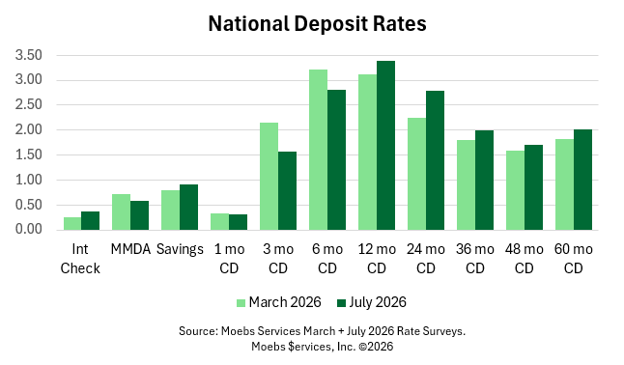
Key Deposit Rate Movements:
- The deposit rate peak shifted from 6-month CD to 12-month CD.
- Short-term rates (MMDA, 1-month, 3-month, 6-month) declined.
- Long-term rates (>12 months) increased.
- The July rates favor 12-month CD topping at 3.38%.
- 2-Month CD rates jumped 55bps, or 25%, to 2.79%.
- Interest checking rates surged 50% to 0.37%.
“Between March and July 2026, deposit pricing moved away from the three and six-month terms and toward 12 and 24-month CDs,” observed Proesel. “This implies depositories are paying more to secure deposits for somewhat longer periods while keeping long-term funding costs restrained even though Treasury yields > 2 years jumped 50+ bps.”
Treasury Yields Signal Deposit Strategy Shift
Measuring the relationship between Treasury yields and deposit rates identifies benchmarks and rate trends for pricing rates efficiently and profitably, reminded Proesel. (The table below compares the average National Deposit Rates to average Treasury Yields for the first three weeks of July 2026.)
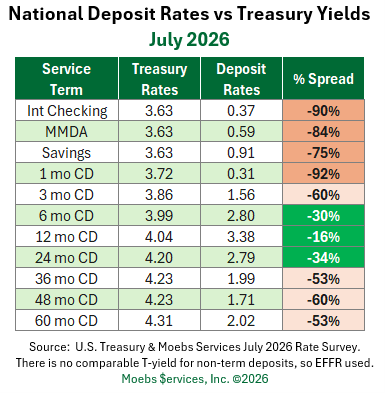
“This table is a stake in the ground to benchmark the fluctuating rate market, shifting yield curve and anticipated rate hikes later this year,” advised Proesel.
- Treasury Yields significantly exceed deposit rates across all terms by 16% to 92% with most significant spreads at short terms < 3 months and long terms > 36 months.
- The 12-month CD offers the strongest relative value compared to Treasury yields with the narrowest spread of 16%.
- The 12-month CD dominates the deposit rate market, as depositories compete for stable funding without fully committing to rising long-term rates (also noted in bar graph above).
- The 2-Yr T-Note yield increased 54 bps in the last 3 months. The 2-Yr Note is an early indicator of market sentiment for future Fed rate expectations and a critical linchpin in the yield curve.
Proesel urged depositories to be proactive and price deposits purposefully with Treasury yields top of mind.
“Depositories historically could leisurely lag Treasury rate increases without getting caught flat-footed,” noted Proesel. “However, in the current environment of steadily rising rates intensified by deposit mobility, depositories can’t afford to be complacent with traditional rate strategies. Know your biggest competitor, the U.S. Treasury, and reprice frequently with the yield curve as a benchmark.”