

By Ray Birch
LAKE FOREST, Ill.—Who is wearing the white hat today when it comes to overdrafts?
While credit unions have long claimed that hat for themselves, a new report says the answer clearly isn’t CUs—but it’s also not banks.
Instead, the latest overdraft report from Moebs $ervices reveals fintechs are now the good guys when it comes to OD price and policy.

The findings come at a critical time, with overdraft/NSF fees under fire from the CFPB, consumer groups, media outlets and some in Congress. Moreover, during the second quarter of this year NCUA is for the first time ever collecting data on large credit unions’ NSF/OD income.
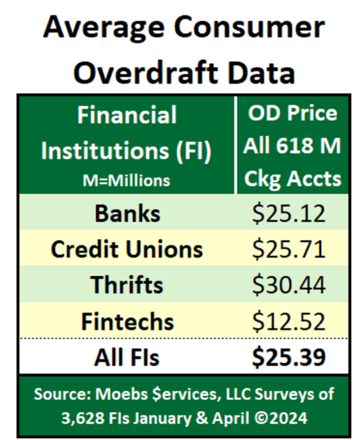
The latest Moebs $ervices data show that at the close of 2023 fintechs charged an average OD price of $12.52, banks $25.12, credit unions $25.71 and thrifts $30.44 (see chart).
That finding follows a CUToday.info report that reveals credit unions are much more dependent on overdraft income than banks.
The Fintech Thinking
“Fintechs, for the most part, do not charge for overdrafts, and those that do charge have very low prices,” said Michael Moebs, economist and chair of Moebs $ervices. “Their thinking is to attract consumers who do not overdraw much but transact a lot. This increases their interchange fees and helps to make their checking profitable.”
Given the scrutiny they are facing, can credit unions, again put on the overdraft white hat?
“Credit unions must start making their checking profitable,” said Moebs. “Your mom and dad always taught you to protect yourself first and never cause a fight. CUs must do the same with checking. Loans and investments produce revenue. Checking can bring in revenue, too, with interchange fees, reasonable charges for making errors with transactions, and teaching the member to help keep costs low.”
A Dramatic Market Shift
Moebs emphasized the overdraft landscape has shifted dramatically over the last five years.
“COVID helped pass the baton to the financial institutions wearing the white hats,” he said. “Working at home eliminated travel time to the job. The average consumer started to learn their checking account can save them money by doing more day-to-day transactions online—less trips to the grocery store and less gas purchases. Fed Chair (Jerome) Powell eliminated transaction restrictions on savings and money market deposit accounts. Fintechs saw these financial behavioral changes and, like any good competitor, grabbed the white hat and said to consumers, ‘Follow the white hat guys to savings and service.’”
List Price vs. Actual Price
As Moebs has explained in previous CUToday.info reports, the “list” overdraft price differs from the “actual” price.
“Market share is determined by the number of goods or services sold in the market,” Moebs said. “OD price market share is driven by consumer checking ac

Michael Moebs
counts. Take the case of a 10-FI market where nine of the 10 FIs charge $30 per OD. One charges $10. The average OD list price is $28. The market has 100,000 checking accounts. The FI charging $10 has 75,000 checking accounts. So, the average actual price is $15.”
The latest data show that for all financial institutions the average OD list price is $30, but the actual price is $25.39.
“Now that the number of checking accounts is known from call reports of all FIs, it is more accurate to use the actual OD price, yet contrast the actual price with the list OD price to further help,” he said.
A ‘Startling Result’
The “startling result,” according to Moebs, is overdraft revenue actually rose in 2023.
“Adam Smith was right. In ‘The Wealth of Nations’ published in 1776, Smith wrote if you lower the price of a good or service, the volume rises. It is a donnybrook for lowest OD price leader and the only one left standing is the consumer who benefits from a much lower price.”