
Moebs Chart 1
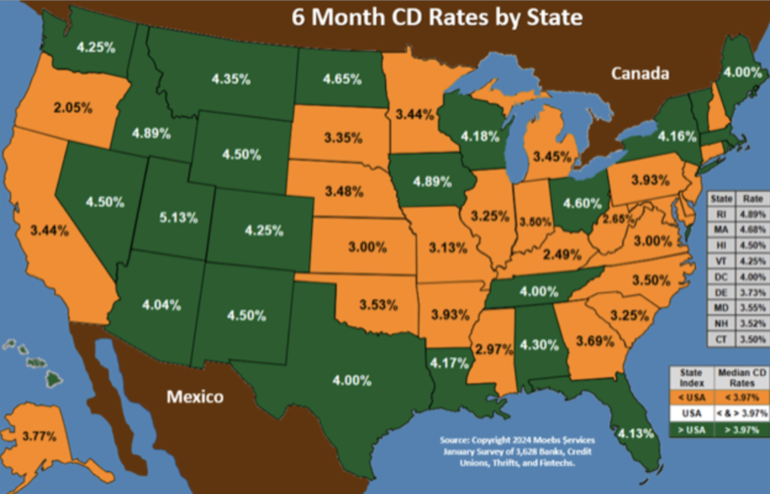
Those states in the green are above the national rate and those in orange below the national rate.

Those states in the green are above the national rate and those in orange below the national rate.