
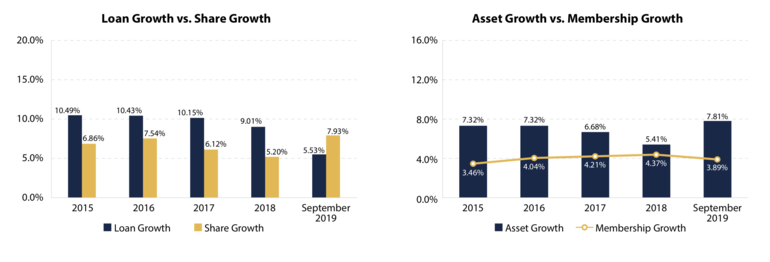
ALEXANDRIA, Va.–Credit union assets were up nearly 7% during the third quarter, with loans growing nearly 6% over the same period, although the overall loan-to-share ratio declined by three percentage points from the same period one year earlier, according to NCUA’s latest Quarterly Credit Union Data Summary.
But credit unions in the smallest asset size categories continue to struggle. Among the now 1,447 CUs with assets of less than $10 million, for example, loans were down 4.7%, membership declined 8.7% and net worth fell 4.5%. Consistent with a long-running trend, CUs of more than $1 billion in assets showed the strongest growth.
The Quarterly Credit Union Data Summary provides an overview of the financial performance of federally insured credit unions based on Q3 Call Report Data from federally insured credit unions. According to NCUA, those CUs ended Sept. 3 with 119.6 million members.
Performance By Category
According to the agency’s data, here’s how credit unions performed by category during the third quarter:
- Total assets in federally insured credit unions rose by $98 billion, or 6.8%, over the year ending in the third quarter of 2019, to $1.54 trillion.
- Total loans outstanding increased $61 billion, or 5.9%, over the year to $1.1 trillion. The average outstanding loan balance in the third quarter of 2019 was $15,530, up $262, or 1.7%, from one year earlier.
- The delinquency rate at federally insured credit unions was 67 basis points in the third quarter of 2019, unchanged from one year earlier. The net charge-off ratio was 55 basis points, down slightly from 57 basis points in the third quarter of 2018.
- Insured shares and deposits rose $72 billion, or 6.3%, over the four quarters ending in the third quarter of 2019, to $1.2 trillion.
- The loan-to-share ratio stood at 84.1% in the third quarter of 2019, down from 84.9% in the third quarter of 2018.
- The credit union system’s net worth ratio was 11.39% in the third quarter of 2019, compared with 11.21% one year earlier.
- Net income totaled $14.7 billion at an annual rate in the third quarter of 2019, up $1.1 billion, or 8.0%, from the same period a year ago.
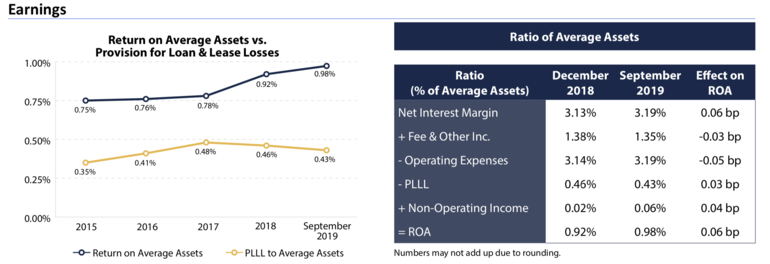
- The net interest margin for federally insured credit unions was $47.7 billion in the third quarter of 2019, or 3.2% of average assets. That compares with $44.0 billion, or 3.1% of average assets, in the third quarter of 2018.
- The return on average assets for federally insured credit unions was 98 basis points over the year ending in the third quarter of 2019, up from 96 basis points in the third quarter of 2018. The median return on average assets across all federally insured credit unions was 65 basis points, up 5 basis points from the third quarter of 2018.
- The number of federally insured credit unions declined to 5,281 in the third quarter of 2019, from 5,436 in the third quarter of 2018. In the third quarter of 2019, there were 3,321 federal credit unions and 1,960 federally insured, state-chartered credit unions. The year-over-year decline is consistent with long-running industry consolidation trends.
- The number of credit unions with a low-income designation rose to 2,615 in the third quarter of 2019 from 2,561 one year earlier.
- Federally insured credit unions added 4.1 million members over the year, and credit union membership in these institutions reached 119.6 million in the third quarter of 2019.
Balance Sheet Details
Assets
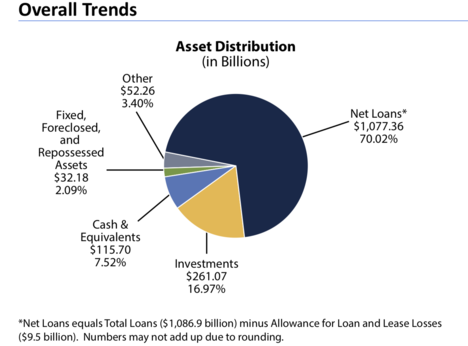
- Total assets in federally insured credit unions rose by $98 billion, or 6.8%, over the year, to $1.54 trillion in the third quarter of 2019.
- Cash and equivalents (assets with maturity of three months or less) increased $23.9 billion, or 26.1%, to $115.7 billion.
- Total investments (instruments with maturities in excess of three months) rose $5.0 billion, or 1.9%, to $261.1 billion.
- Investments with maturities of less than one year rose $6.5 billion, or 9.0%, to $78.7 billion.
- Investments with maturities of one to three years rose $6.7 billion, or 7.7%, to $93.4 billion.
- Investments with maturities of three to five years fell $7.9 billion, or 12.8%, to $53.7 billion.
- Investments with maturities of five to 10 years declined $2.1 billion, or 6.5%, to $29.9 billion.
- Investments with maturities greater than 10 years increased $1.7 billion, or 47.1%, to $5.4 billion.
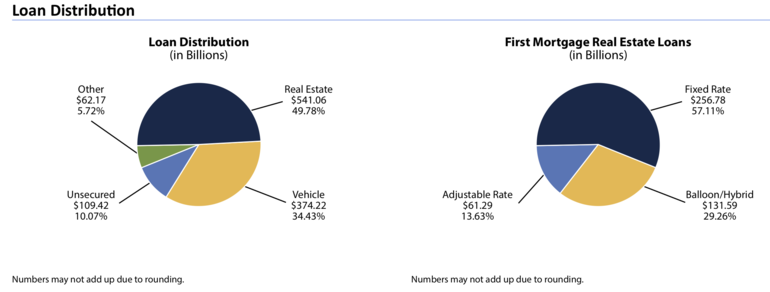
- Total loans outstanding increased $61 billion, or 5.9%, over the year, to $1.1 trillion. Credit union loan balances rose over the year in every major category, compared with the third quarter of 2018.
- Loans secured by 1- to 4-family residential properties increased $26.8 billion, or 6.1%, to $466.8 billion in the third quarter of 2019.
- Auto loans increased $12.6 billion, or 3.5%, to $374.2 billion. Used auto loans rose $9.5 billion, or 4.4%, to $226.9 billion. New auto loans rose $3.1 billion, or 2.1%, to $147.3 billion.
- Credit card balances rose $4.4 billion, or 7.4%, to $63.8 billion
- Non-federally guaranteed student loans rose $0.5 billion, or 10.6%, to $5.5 billion.
- Commercial loans, excluding unfunded commitments, increased $9.1 billion, or 13.2%, over the year to $78.0 billion in the third quarter of 2019. Commercial loans are not directly comparable to member business loans.
- The delinquency rate at federally insured credit unions was 67 basis points in the third quarter of 2019, unchanged compared with the third quarter of 2018. Loan performance was mixed across major categories:
- The delinquency rate on fixed-rate real estate loans was 44 basis points in the third quarter, up slightly from 41 basis points one year earlier.
- The credit card delinquency rate rose to 132 basis points from 127 basis points in the third quarter of 2018.
- For auto loans, the delinquency rate edged down 2 basis points to 58 basis points in the third quarter of 2019.
- The delinquency rate for commercial loans, excluding unfunded commitments, declined to 69 basis points in the third quarter of 2019, from 75 basis points in the third quarter of 2018.
- The net charge-off ratio for all federally insured credit unions was 55 basis points in the third quarter of 2019, compared with 57 basis points in the third quarter of 2018
Liabilities and Net Worth
- NCUA reported credit union shares and deposits rose by $83.7 billion, or 6.9%, over the year, to $1.29 trillion in the third quarter of 2019. Regular shares declined $1.6 billion, or 0.4%, to $443.1 billion. Other deposits increased $60.2 billion, or 10.2%, to $648.9 billion, led by share certificate accounts, which were up $50.5 billion, or 22.3%.
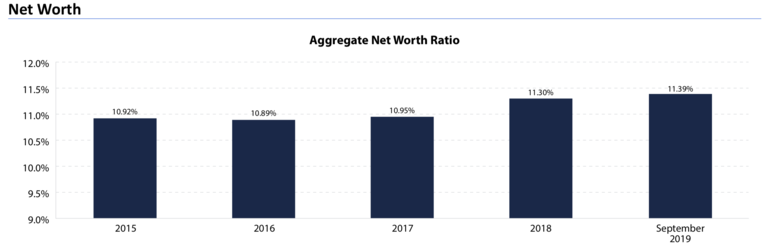
- The credit union system’s net worth increased by $13.7 billion, or 8.5%, over the year, to $175.2 billion. The aggregate net worth ratio — net worth as a percentage of assets — stood at 11.39% in the third quarter of 2019, up from 11.21% one year earlier.
Income Statement Details
-
Net income for federally insured credit unions in the third quarter of 2019 totaled $14.7 billion at an annual rate, up $1.1 billion, or 8.0%, from the third quarter of 2018. Interest income rose $7.8 billion, or
14.7%, over the year to $60.8 billion, and non-interest income increased $1.2 billion, or 5.8%, to $21.0 billion.
- Interest expensetotaled $13.1 billion annualized in the third quarter of 2019, up $4.0 billion, or 44.0%, from one year earlier. Non-interest expenses grew $3.8 billion, or 8.7%, over the year to $47.7 billion in the third quarter. Rising labor expenses, which were up $2.1 billion, or 9.2%, accounted for more than half of the increase in non-interest expenses.
- The aggregate net interest margin widened by $3.8 billion over the year, or 8.6%, to $47.7 billion at an annual rate in the third quarter of 2019.
- The credit union system’s provision for loan and lease losses or credit loss expense edged up $0.03 billion, or 0.4%, over the year, to $6.4 billion at an annual rate in the third quarter of 2019.
Performance by Asset Category
NCUA again noted that “consistent with long-running trends, credit unions with assets of at least $1 billion reported the strongest growth in loans, membership, and net worth over the year ending in the third quarter of 2019. Credit unions with less than $500 million in assets reported declines in those categories over the year.”
- The number of federally insured credit unions with assets of at least $1 billion increased to 319 in the third quarter of 2019 from 303 in the third quarter of 2018. These 319 credit unions held $1.0 trillion in assets, or 67% of total system assets. Credit unions in this category reported loan growth of 8.8%. Membership rose 7.9%. Net worth increased 12.0%.
- The number of federally insured credit unions with assets of at least $500 million but less than $1 billion rose to 255 in the third quarter of 2019 from 240 in the third quarter of 2018. These 255 credit unions held $179.2 billion in total assets, or 12% of total system assets. Credit unions in this category reported a 4.9% increase in total loans outstanding over the year. Membership rose 3.8%, and net worth increased 6.6%.
- The number of federally insured credit unions with at least $100 million but less than $500 million in assets declined to 1,012 in the third quarter of 2019 from 1,031 in the third quarter of 2018. These 1,012 credit unions held $225.1 billion in total assets, or 15% of total system assets. Credit unions in this category reported a 3.3% decline in total loans outstanding. Membership fell 5.4%. Net worth edged down 0.3%.
- The number of federally insured credit unions with at least $50 million but less than $100 million in assets declined to 682 in the third quarter of 2019 from 690 in the third quarter of 2018. These 682 credit unions held $48.9 billion in total assets, or 3% of total system assets. Credit unions in this category reported a 0.3% decrease in total loans. Membership fell 3.2%. Net worth rose 1.8%.
- The number of federally insured credit unions with assets of at least $10 million but less than $50 million declined to 1,661 in the third quarter of 2019 from 1,725 in the third quarter of 2018. These credit unions held $41.7 billion in assets, or 3% of total system assets. Credit unions in this category reported a 1.7% decrease in loans. Membership declined 5.2%. Net worth fell 0.6%.
- The number of federally insured credit unions with less than $10 million in assets declined to 1,352 in the third quarter of 2019 from 1,447 in the third quarter of 2018. These credit unions held $5.6 billion in assets, or 0.4% of total system assets. Credit unions in this category reported a 4.7% decline in loans. Membership fell 8.7%. Net worth declined 4.5%.